The Challenge
Transforming raw, unstructured datasets into executive-ready dashboards traditionally demands manual cleaning, SQL authoring, schema guesswork, and manual chart design.
Architectural Solution
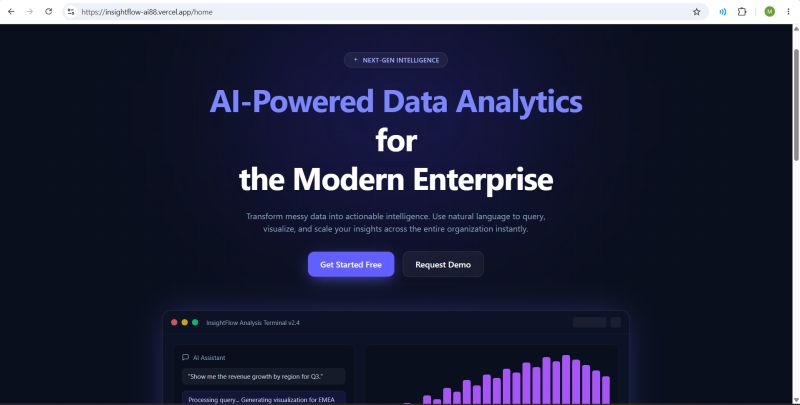
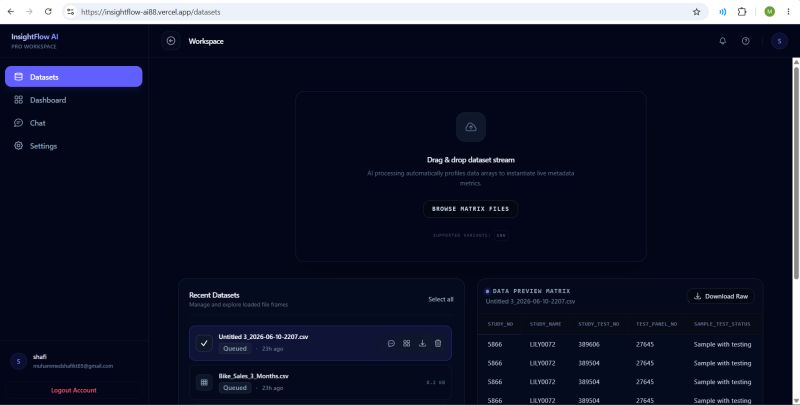
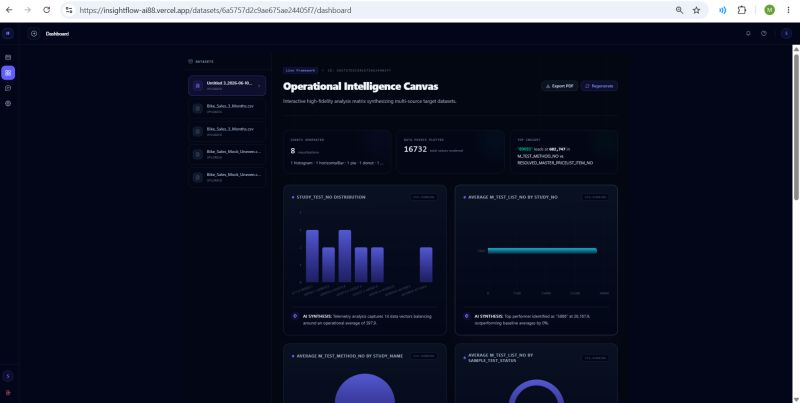
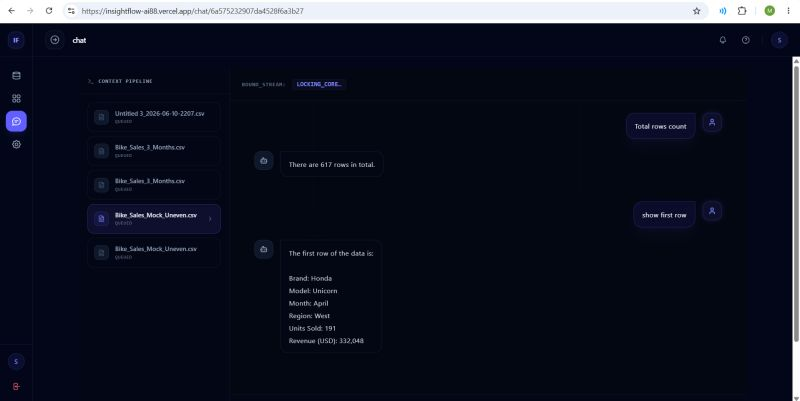
Built a multi-stage analytics pipeline that ingests datasets, profiles distributions, validates schema integrity, and automatically generates interactive dashboards alongside a conversational AI assistant.
Key Engineering Features
- Built a multi-stage analytics pipeline for dataset ingestion, profiling, validation, and interactive dashboard generation
- Implemented DuckDB-based analytics querying large datasets directly from Cloudflare R2 without heavy disk download overhead
- Integrated Redis and BullMQ background processing to keep the API server responsive during heavy jobs
- Real-time job progress and status updates streamed directly to the frontend via Socket.IO
- Automated server-side PDF report generation using headless Puppeteer
- Natural-language Q&A and dataset interrogation powered by OpenAI SDK and LLM integration
ARCHITECTURE PIPELINE FLOW:
React · Vercel→Express API · AWS EC2→BullMQ / Redis Queue→DuckDB over Cloudflare R2→MongoDB Job State→Socket.IO Real-Time Stream
Critical Technical Decisions
- DuckDB over Cloudflare R2: Executes columnar queries directly on remote objects, avoiding high memory footprint on the API server
- Redis + BullMQ Queue: Decouples resource-intensive dataset profiling and PDF compilation into isolated background workers
- Socket.IO WebSockets: Streams live ingestion percentages and step transitions without client polling overhead
Authentication & Deployment
Cookie-based JWT authentication with Google OAuth. Express backend deployed on AWS EC2 behind Nginx reverse proxy; React frontend deployed on Vercel.
React.jsRedux ToolkitNode.jsExpress.jsMongoDBDuckDBRedisBullMQSocket.IOCloudflare R2AWSOpenAI SDKPuppeteer